I am aware that there are entire fields as well as high impact journals that overlook this mistake, but I want to bring up, (yes, again), why you should always use the standard deviation when drawing error bars or reporting the uncertainty about the data you actually collected; that is, why you should not report the standard error, (which is just a passing calculation when you are estimating what you think the population is like based on what your data are like). And, by the way, it’s not just me, NIST (the IS stands for International Standards, so they aren’t fooling around) says so, too.
Check out this definition of standard (from http://www.oxforddictionaries.com/us/definition/american_english/standard): “An idea or thing used as a measure, norm, or model in comparative evaluations.” ‘Comparative evaluations’ is what I want to emphasize here – when you draw bars indicating the uncertainty in the data you collected, those bars should be comparable to everyone else’s bars. Standard error bars are not comparable and they make your audience have to do extra work to figure out what you found; how annoying! In contrast, standard deviations always mean the exact same thing! How nice for your audience!
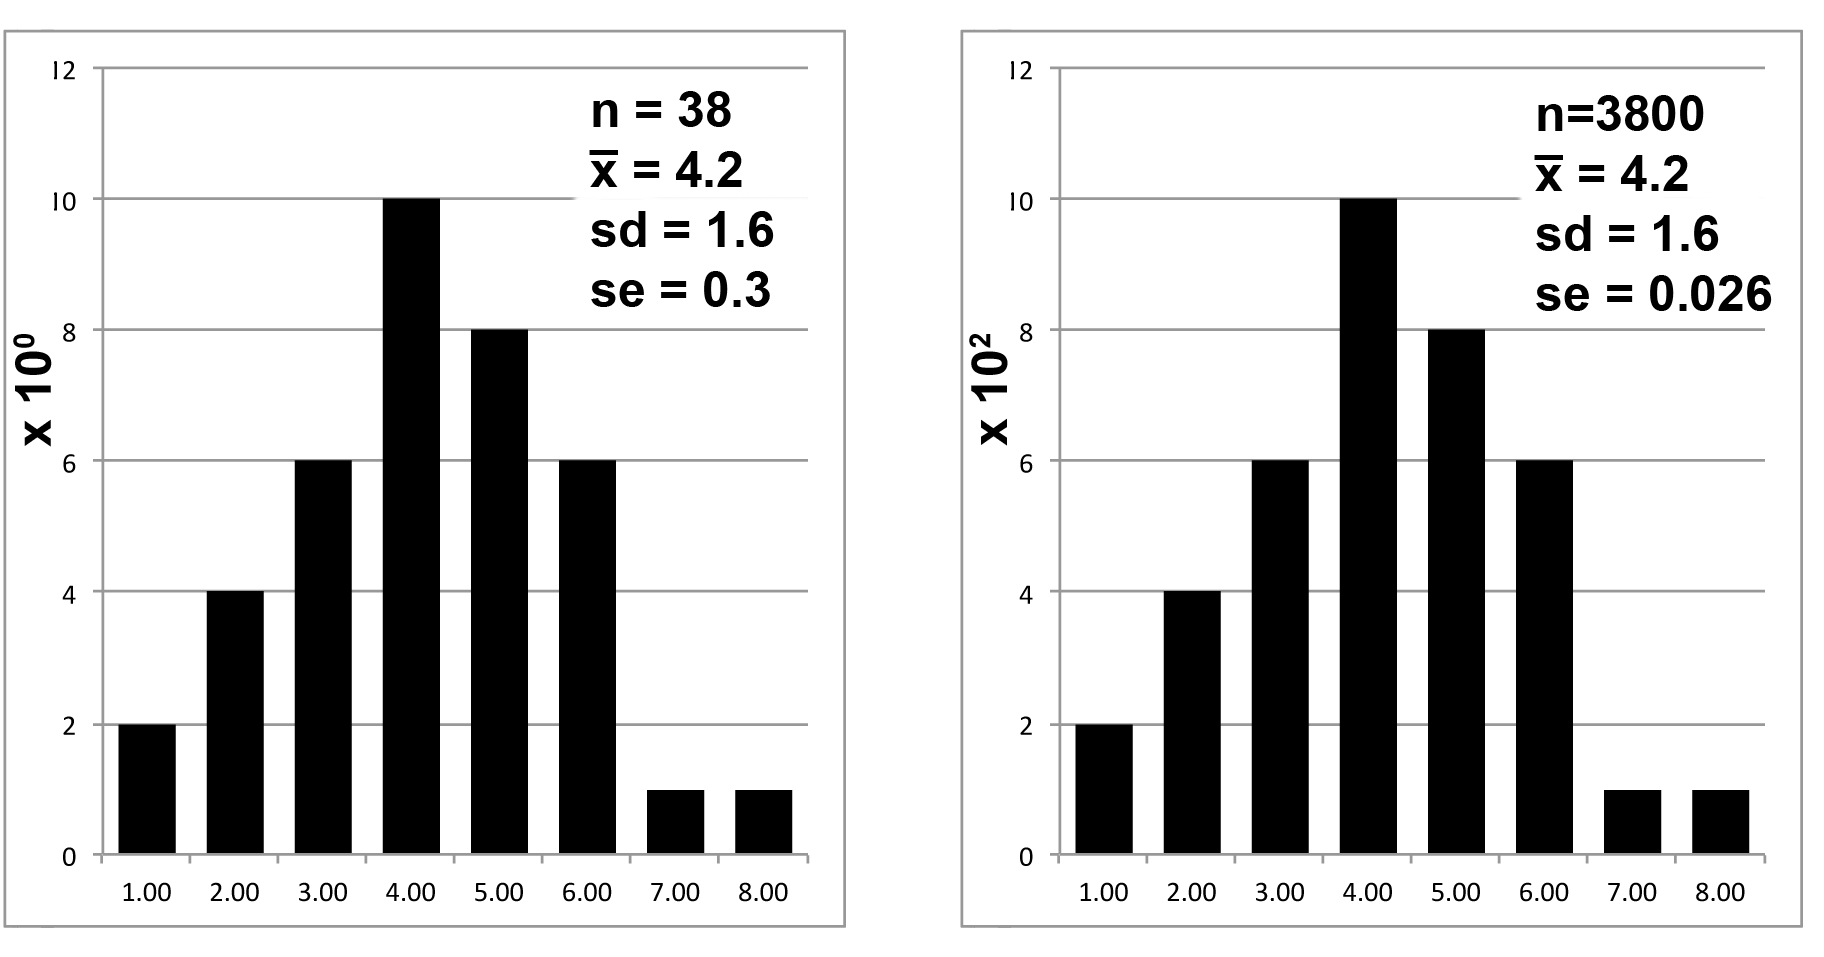
The first step of reporting any data set (collection of measurements) is to describe the distribution of your data. To do that, you first make a frequency plot – the x-axis shows the values of your measurements, the y-axis shows the number of times you got each of those values, like in figure 1. Then, you summarize the distribution by saying where the center is and how the measurements are spread out around that center point.
Important aside: Thinking in terms of distributions will help with doing statistical analysis, too. Unless you are using non-parametric statistics, the statistics you will use tell you about distributions, not absolute numbers. As smart as they are, even statisticians cannot predict your data. So in many ways, I advise thinking about the distribution of your data as soon as you possibly can
Figure 1 shows identical frequency plots. Note, though, the scales of the y-axes have been changed to indicate different sample sizes; nevertheless, the distributions of the data points are exactly the same. If the distributions are identical, it follows that the description of the distributions should be identical. And the standard deviations are, indeed, identical: 1.6 and 1.6.
But look what happens to the standard error because of the difference in sample size: 0.3 vs 0.03 is a difference of an order of magnitude, even though the distributions are, you may remember, identical. Standard error is not a comparable evaluation. QED.
Here is a visual that shows what happens when the frequency distribution data are presented in summary form, the kind of figure you are more like to see in a paper:
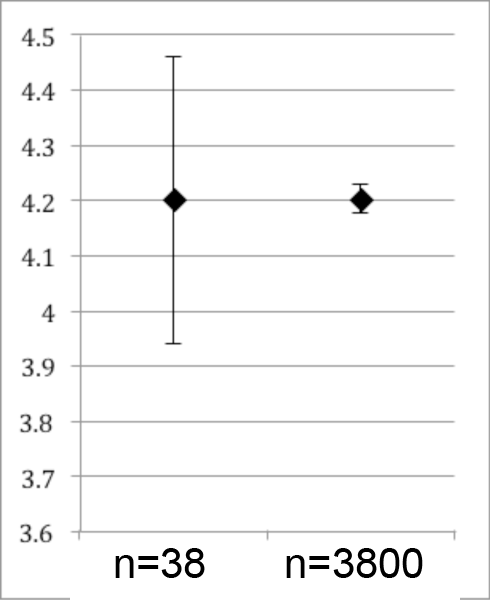
The data on the right may “look” better, but that kind of spin is frowned upon in science, since your audience will assume it describes the spread of your data, but it does not. The standard error is not standard.
I hope it is pretty clear at this point that the standard error cannot be a “standard” way to describe the distribution of your data. Did someone tell you it was OK or traditional to use standard error as long as you say what your sample size was? True, to a point, but is it OK to divide your uncertainty by 10 as long as you say you did it? I recommend going to that person and saying “I’m confused. You said to use the standard error, but this easy to understand article by well respected biostatistician David Streiner (Maintaining standards: differences between the standard deviation and standard error, and when to use each. Can J Psychiatry. 1996 Oct;41(8):498-502; https://www.ncbi.nlm.nih.gov/pubmed/8899234) says that is wrong.” It’s a teachable moment; question authority.
The distribution of your data was what it was – don’t make it look like you are trying to hide something: share it proudly and accurately using the agreed upon standard. You surely worked hard enough to collect it. Also, to repeat myself, the international community of scientists has declared that the standard deviation is the correct way to report uncertainty; so, reporting standard error is like reporting length in cubits instead of meters, and that is just being ornery for no good reason.
So, where does that leave standard error?
There are two kinds of statistics: descriptive and inferential. Above, I’ve been pontificating about descriptive statistics – numbers that describe the distribution of the measures you actually made on your sample. IF your data are normally distributed, mean and standard deviation are useful summaries of what you found, because they are standard so just two numbers will give your audience an interpretable summary of your data.
Inferential statistics let you make inferences about the population from which the sample came. I think it is fairly intuitive that if you measure many more individuals (that is, your sample size is bigger), your estimate of the distribution of the entire population will get better and better. One way to think about this is to look at the extremes: if your sample size is 0, you will make an absolutely terrible estimate of the mean of the population. If your sample size equals the size of the population, your estimate will be perfect. In between, the bigger your sample size, the closer to perfection you get with your estimate of the whole population. Thus, it is when you are calculating inferential statistics that you should take into account the sample size.
One useful statistic to report when discussing your inferences about the population is the confidence interval. It tells your audience the range within which you believe the mean of the population would be found. As always with statistics (“statistics means never having to say you are sure”), you also tell your audience the degree of confidence you have in those intervals. To calculate confidence intervals, divide your standard deviation by the square root of the sample size then multiply that quotient by 1.96, if you want to indicate that you are 95% confident, or 2.58 if you are 99% confident. That quotient, for some reason, got a name: the standard error. In other words, standard error is just a rest stop on the road trip towards confidence intervals: you might be tempted to stop in for little chocolate donuts and coffee, but you really don’t want to linger there or brag about having been there. Just keep moving towards your goal.
I will end with a rule of thumb for interpreting graphs that (annoyingly) show standard error instead of standard deviation: in your head, double them, and that will give you a reasonable estimate of the 95% confidence intervals, although it will still leave you unclear about the data the authors collected. YOU will never make your readers do that, right?
Discussion
No comments yet.